VWAP and deviation bands: what they tell you and what they don't
VWAP is one of the benchmarks institutions use most often – and one of the indicators retail traders misunderstand most. This article explains what it is and how to think about it.
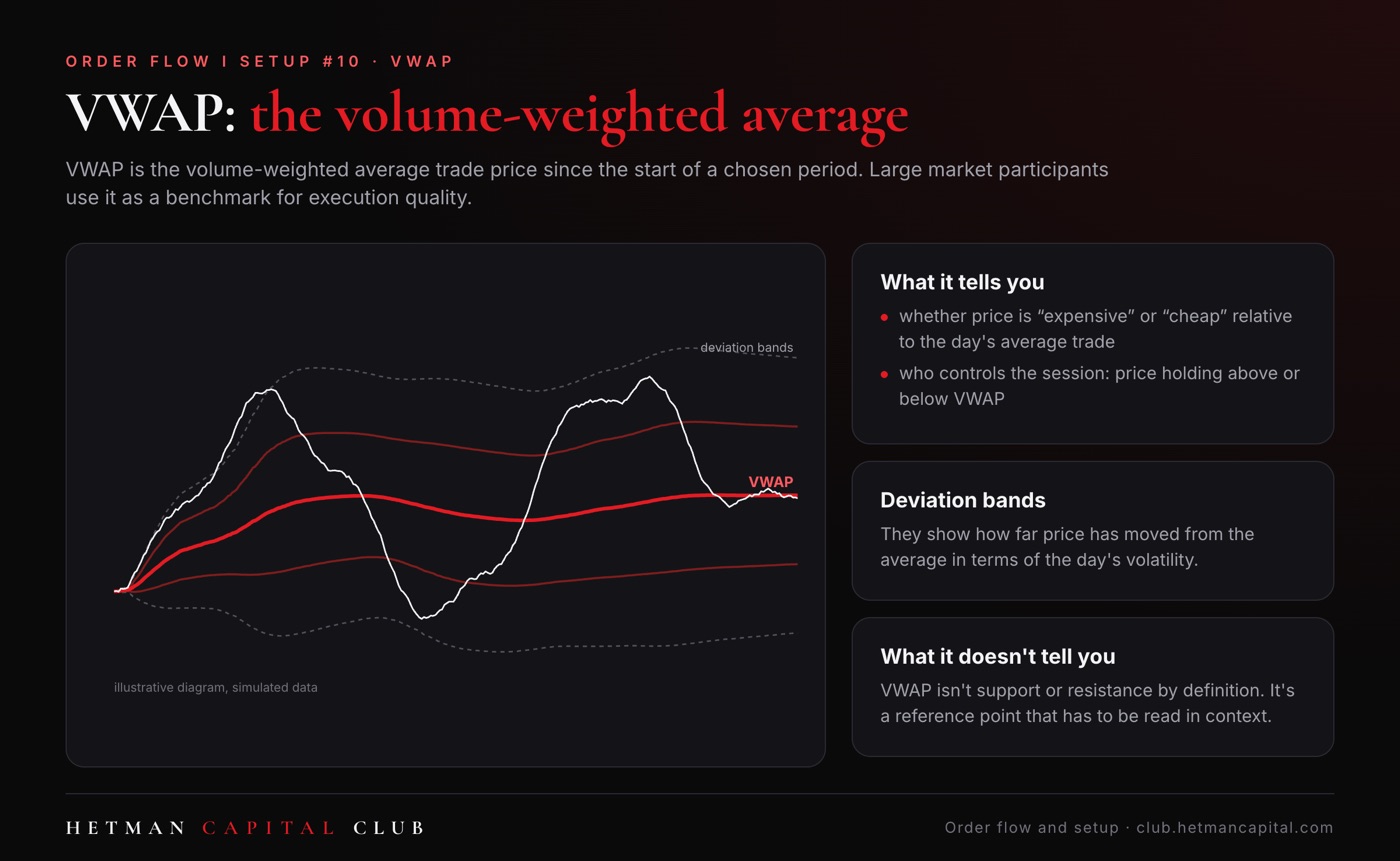
What VWAP is
VWAP (Volume Weighted Average Price) is the average price of all trades since the start of a chosen period, weighted by their volume. In practice it answers the question: what price did the average market participant pay during this period?
Large market participants, such as funds working big orders, often judge execution quality against VWAP. Buying below VWAP is a “good” fill, above it an “expensive” one. So VWAP matters not because it's a magic line, but because many participants use it as a reference point.
How to think about it
- Price holding above VWAP: buyers are paying more and more, and the average buyer in this period is “in profit”. It's a sign of buyer strength in that period.
- Price holding below VWAP: the same, for the sellers.
- Price rotating around VWAP: balance, no clear advantage.
Deviation bands
Standard deviation bands around VWAP show how far price has moved from the average in terms of the period's volatility. A big stretch from VWAP tells you about the size of the move relative to what the market has so far “considered normal”. It's context, not a recipe. In a strong trend, price can ride the outer bands for a long time.
VWAP from different starting points
VWAP can be calculated from the start of the regular session, from the start of the full trading day, from the start of the week, or from an important event such as a data release (anchored VWAP). Each answers a question about a different group of participants: who has been buying since the open, since the start of the week, since the data release.
What VWAP doesn't tell you
- it isn't support or resistance by definition
- it doesn't predict direction
- it loses its informational value on very low volume
- one line can't replace the context from the profile and levels (article #9)
How I use it
VWAP is one of the context layers on my chart. What matters to me is how price and order flow behave at VWAP and its bands: does the market accept the move away, or return to the average? In the 🔴 Live Room I show how the same line means different things depending on the day type (article #11).
Exercise
For 5 sessions, note how much time price spends above and below the regular-session VWAP and how that relates to the day type. Write your observations down in the 📒 Trader's journal.
Educational content, not investment advice. No signals, entries or position sizes.

♛ The Hetman Terminal is part of Club: live for Dow Jones from the Bishop plan, 6 markets (Dow Jones, S&P 500, Nasdaq, gold, crude oil, Bitcoin) and automatic detection of order flow events from the Rook plan. A session on the ♛ Hetman Index (training, simulated data) in the full panel comes with the Knight plan and above. Compare the plans →